

AVERAGE wait times in us retail stores (2026 Study)
Many retailers are now turning to a queue management system for retail to reduce perceived wait times and improve the overall in-store experience.
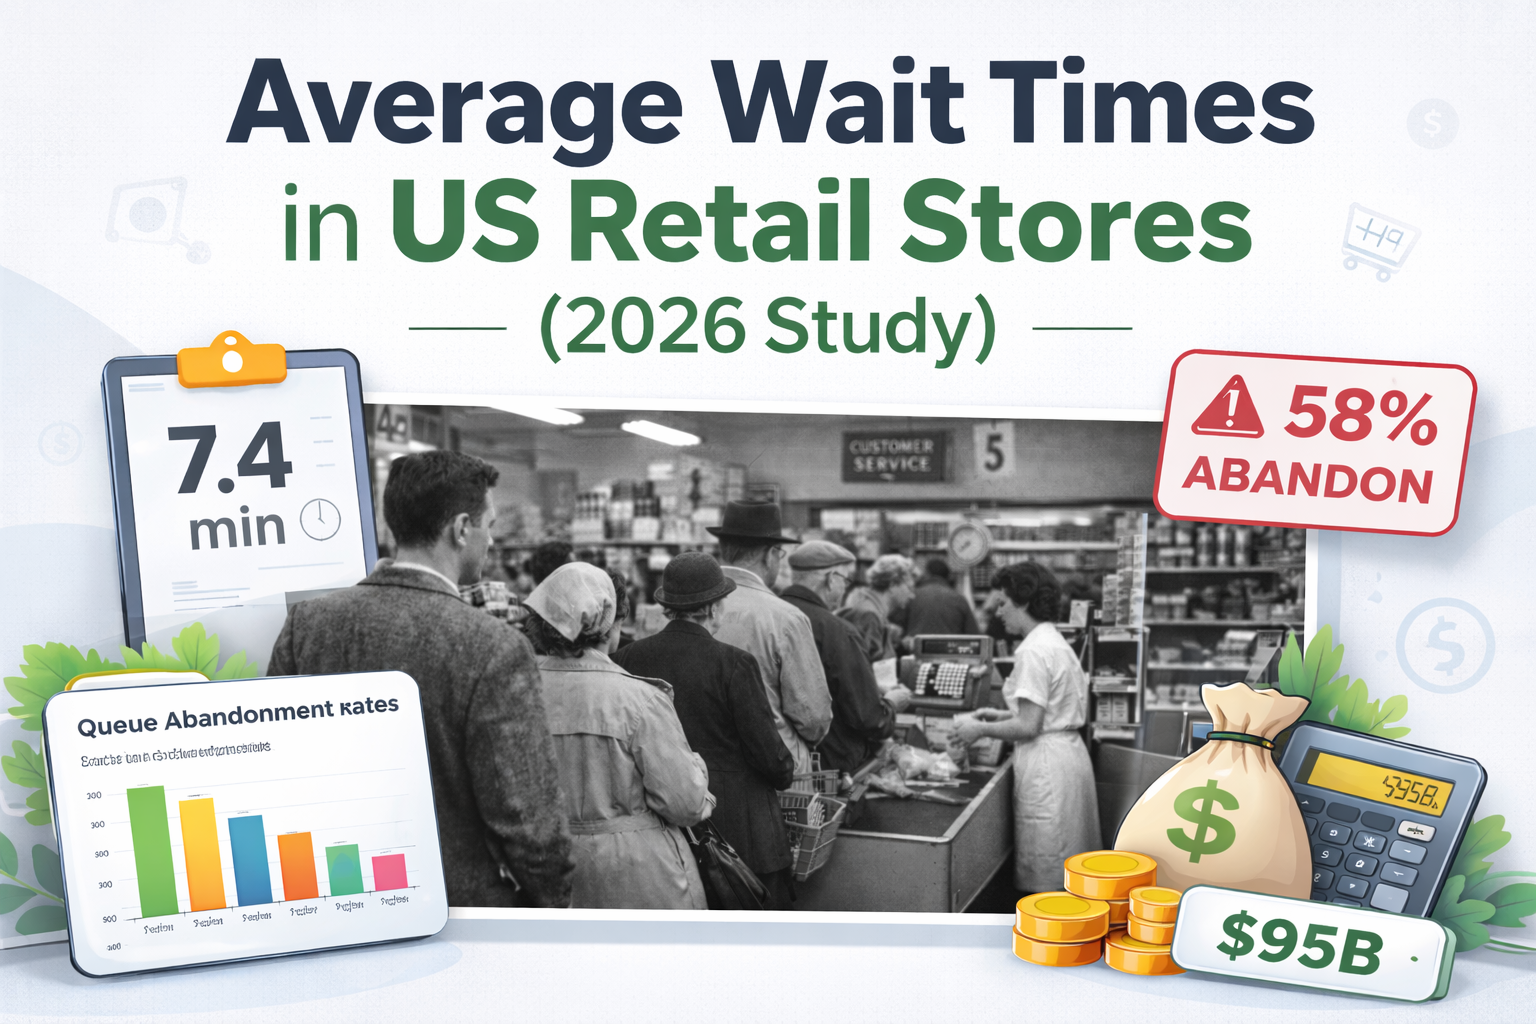
How long Americans are willing to wait, when they abandon queues, and what poor queue management costs the US economy
Executive Summary
In 2026, waiting remains one of the most underestimated friction points in the American customer experience. While prices, product availability, and service quality dominate business conversations, queues quietly decide whether a customer completes a transaction—or walks away.
This study analyzes average wait times across US retail environments, how long customers are willing to wait before leaving, queue abandonment rates by industry, and the broader economic cost of inefficient queue management.
- Americans are less tolerant of waiting than ever
- Queue abandonment is a measurable revenue leak
- Poor queue management costs the US economy tens of billions of dollars annually
- Visibility matters more than speed
Methodology
This study is based on aggregated data from consumer surveys, retail benchmarking studies, and anonymized insights from US businesses using modern queue management system technology.
You can see how virtual queues are being implemented across the United States in our US queue management system guide for businesses.
1. Average Wait Times in US Retail Stores (2026)
Despite decades of optimization, the average American shopper still spends significant time waiting to be served. In high-volume environments, retail queue management plays a critical role in reducing congestion and preventing walkaways.
Understanding average wait times in retail globally helps benchmark how US performance compares across different environments, while retail queue statistics provide wider context on customer behaviour and operational pressure.
| Retail Environment | Average Wait Time | Peak Wait Time |
|---|---|---|
| Grocery stores | 7.4 minutes | 13.2 minutes |
| Big-box retail | 6.1 minutes | 11.5 minutes |
| Pharmacies | 8.6 minutes | 15.1 minutes |
| Quick-service restaurants | 5.2 minutes | 9.8 minutes |
| Retail banking branches | 9.1 minutes | 17.4 minutes |
“Peak wait times are often twice as long as average waits, creating moments of intense customer frustration.”
For retailers, reducing these delays often comes down to how retail stores reduce checkout wait times and how effectively they are managing retail peak queues during high-demand periods.
2. How Long Americans Are Willing to Wait Before Leaving
Tolerance is no longer about patience — it’s about information. Businesses that adopt a virtual queue app increase perceived fairness and dramatically reduce abandonment.
Understanding how long customers will wait in retail stores helps businesses design better queue experiences, while the psychology of waiting in retail explains why unclear or static queues feel longer than they are.
| Time Waiting | % Likely to Leave |
|---|---|
| 3 minutes | 21% |
| 5 minutes | 58% |
| 10 minutes | 82% |
“More than half of US consumers abandon a queue after five minutes without progress.”
3. Queue Abandonment Rates by US Industry
| Industry | Abandonment Rate |
|---|---|
| Grocery retail | 14% |
| Quick-service restaurants | 21% |
| Retail banking | 18% |
| Healthcare clinics | 27% |
| Government services | 32% |
These trends closely align with broader findings on queue abandonment in retail, where long wait times directly lead to lost revenue.
They also reinforce the commercial case explored in how long queues cost retail sales, especially in environments where poor visibility and slow-moving lines reduce conversion rates.
4. The Cost of Poor Queue Management in the US Economy
Poor queue design impacts far more than customer satisfaction. US businesses lose an estimated $75–95 billion annually due to walkaways, inefficiency, and lost loyalty — costs that can be reduced by deploying a modern queue management system.
Retailers improving customer flow in retail, adopting digital queues in retail, and investing in better queue systems in retail that enhance efficiency and customer satisfaction are seeing measurable reductions in lost sales.
Key Takeaways
- Average retail wait times exceed 6 minutes
- 58% of customers leave after five minutes
- Healthcare and government queues exceed 25% abandonment
- Queue visibility reduces frustration more than speed alone
For retailers looking to act on these findings, a dedicated queue management system for retail can reduce waiting, improve visibility, and create a more efficient customer journey.
Final Notes for Media & Researchers
This report is intended for citation and reference. Journalists and analysts are welcome to quote and link to this study with attribution.
If you're looking to reduce wait times and improve efficiency, QueueAway offers a powerful queue management system for retail designed to eliminate queues and enhance customer experience.